Excesses and the profit season
11 July 2024 _ News

This week sees the start of the long-awaited earnings season. A season that should slowly distract investors from macro data and make them focus on corporate results. We arrive at this earnings season with valuations that once again show how the market always goes from one excess to another. These excesses today have Artificial Intelligence as their protagonist, but history teaches us that the protagonist changes but not the result.
Profit Season and Valuations
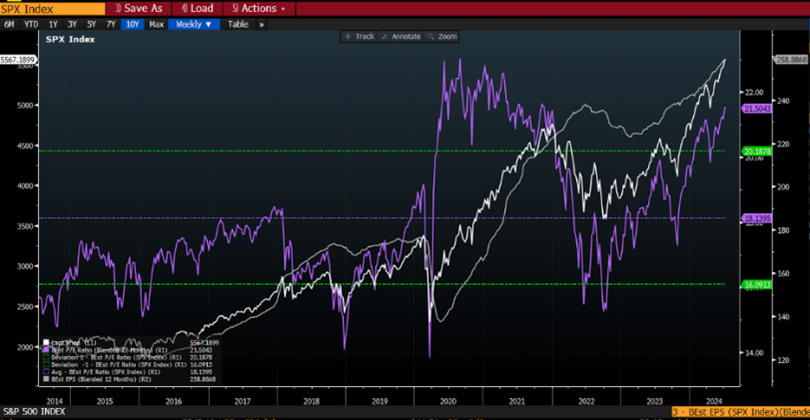
We arrive at earnings season with valuations that have already discounted a lot of positive news in the US. We see this from the Price to Earnings ratio which is 20% above its average. If we look at the performance of the companies that make up the index we see that 81% of the ytd performance is explained by 17 stocks that weigh about 18% with a Price to Earnings ratio of 45x. If we weight these large stocks less and thus take the equi-weighted index, we find a PE at 16x at a 5% discount to its historical average.
This mismatch between large stocks and the market as a whole stems mainly from the weighting of technology, as almost 70% of these large stocks are part of the tech sector. In fact, if we take the tech sector, the price-to-earnings ratio stands at 42, and was at 20 at the end of 2022. This expansion of multiples, greater than 100%, was 4 times the expansion of earnings, which was only 25%. This mismatch between earnings growth +25% and multiples expansion +100% shows us that the market always goes from negativity, end 22, to positive excess. In the negativity there seems to be no price low enough to justify a purchase, it is thought that it will always go down. As today in the positivity it seems that semiconductors have no upward limit. This is an example of how human nature always follows emotion and little rationality.
Moving on to Europe where we have a market multiple still at a discount, compared to the average. This is different from Europe where we have less concentration of performance. In fact, in order to explain 80% of the performance, we have to go up from the 17th to the 45th stock. With an average valuation of 28x PE and not 45x as in the American case.
The characteristic that is characterising the American market, i.e. expensive stocks becoming more expensive and driving performance, is therefore also characterising Europe. To a lesser extent also because Europe has less tech.
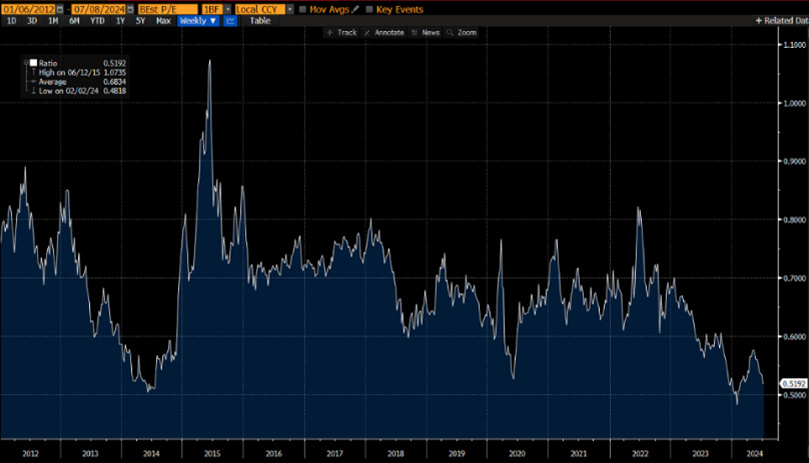
Let us turn to China where the price-to-earnings ratio is at 11x 10% below its average. If we also do the ratio of Chinese PE to American PE, we see that Chinese PE is worth half that of the American on the lows of the last 20 years. It had only touched this level in 2014-2020 and early 2024.
This shows us how the market pendulum is on the extreme positive in America and instead is on the extreme negative in China.
Examples of excesses
Let us look at historical examples of euphoria and how the conclusion is clear: when ‘price does not matter’ is a necessary component and hallmark of a bubble.
Let's start with the first example, the Nifty Fifty. We are in the late 1960s and the craze for ‘Nifty Fifty’ stocks, i.e. the stocks of the highest quality and fastest growing American companies, dominates the international markets. There is a common thread running through the bubbles and exemplified by the Nifty Fifty: the belief that for a certain asset, ‘there can be no price too high’.
The Nifty Fifty started from the idea of growth stocks that began to spread in the early 1970s with the aim of sharing in the rising profits of companies that benefited most from advances in technology, marketing and management. By 1968, the best and fastest-growing companies had appreciated so much that the banks' analysis departments had practically lost interest in all other stocks.
It is very important to point out the loss of investor interest as a sign of the bubble and how this loss of interest tends to recur over time. Going back to the Nifty Fifty everyone wanted to buy Xerox, IBM, Kodak, Hawlett Packard, Texas Instrument, Coca Cola and Avon stocks.
Those companies were so solid that nothing bad could happen to them. And it was a common idea that it didn't matter at all what the price was. If it was a bit too high, no harm done, the companies' profits would still grow, compensating for the expense incurred.
The result was predictable. When people are willing to invest regardless of the price, it is obvious that they do so on the basis of emotions and popularity rather than conducting a cold-blooded analysis.
Thus the Nifty Fifty stocks that had been sold at 80-90 times earnings in 1968, at the height of a powerful bull market, plummeted to the ground as soon as enthusiasm cooled. And many sold again at 8-9 times profits in 1973 with a loss of 80%. Many of these companies went bankrupt or had serious problems.
No asset or company is so good that it cannot become overpriced.
It was clear that everyone had learned their lesson. Or had they?
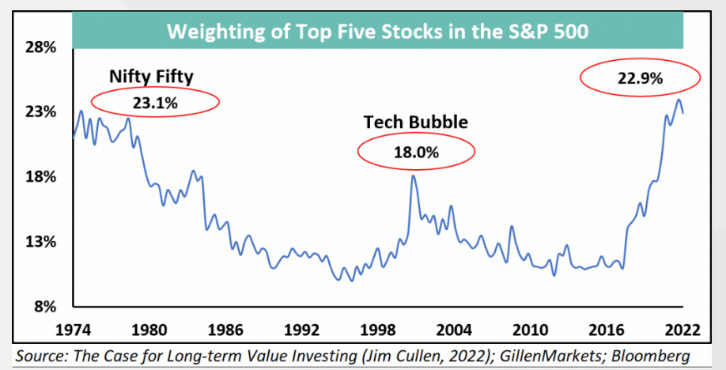
To find out, let us move back to the late 1990s. In this case, the euphoria was driven by the internet revolution. And they were right, the internet has changed the world, which today is unrecognisable compared to thirty years ago. ‘The internet will change the world’ was the battle cry, followed as always by ’no price is too high for an e-commerce stock.’
While Nifty-fifty stocks were being sold at inflated earnings multiples, internet-related stocks were not making profits. For this reason they were not valued on P/E but on turnover, which was often not there. Companies that were listed with the name ending with ‘.net’ went up 50% on the first day of listing! Again, analysts and investors were only interested in internet stocks, losing sight of all other companies. Suffice it to say that 3M in ‘98-99 with the Nasdaq registering +275%, had shown +26%, and then went up 35% in 2000-2002 with the Nasdaq registering -73%. As in the case of the Nifty Fifty, there was a kernel of truth behind the fad, which is usually necessary for a bubble to start.
But investors, when they determined that price was not important, gave up the moorings of reason and discipline.
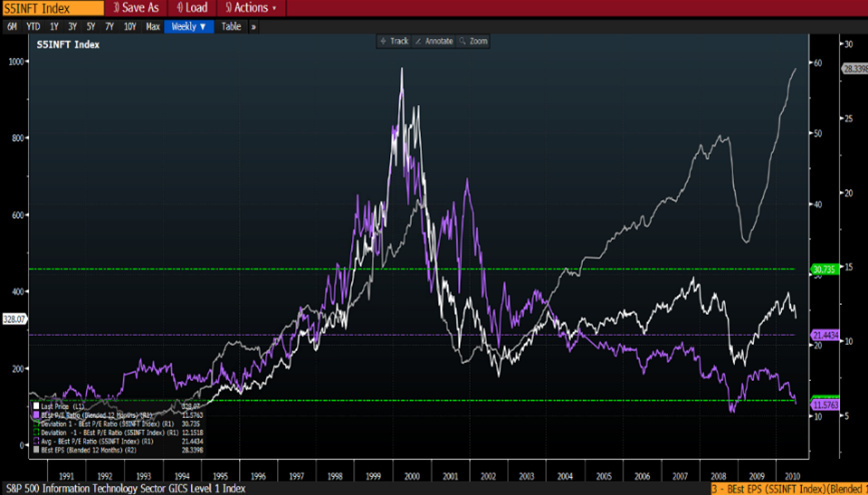
But the vast majority of internet stocks in 1999 and 2000 concerned companies that no longer exist today. If we take, for example, the Price to Earnings ratio at the end of ‘99 had reached around 60x PE (purple line), before collapsing below 20 at the end of 2002. Thus an unmistakable sign of a market that has gone too far.
In early 2000, several prominent investors (Druckenmiller) threw in the towel because their resistance to the technology bubble had proved too painful. Some gave up and switched businesses, others gave up and bought into the bubble.... Just in time to see it burst, compounding their mistake.
Again, it was clear that everyone had learned their lesson.
Or had they?
To find out, let us move back to late 2007. A few years after the euphoria of the internet, came the real estate euphoria. This euphoria hit the heart of the investor i.e. the house. Again, positive expectations fuelled greed, leading to imbalances.
These imbalances driven and supported by rising house prices (right-hand graph) led to the 2008 crisis. Crisis that hit investor confidence and taught Central Banks a lot, especially to react earlier (see the Fed's strong and fast reaction in the 2020 pandemic).
Again, it was clear that everyone had learned their lesson.
Or had they?
These are just a few examples of human nature, namely getting caught up in feelings of euphoria when the market goes up and depression when it goes down. An example even before the 20th century that shows us that human nature is even stronger than intelligence is what happened to Sir Isac Newton.
Newton was the director of the State Mint at the time of the ‘South Sea Bubble’, along with many other wealthy Englishmen.
The stock rose from £128 in January 1720 to £1050 in June. Early in that rise, however, Newton realised the speculative nature of the boom and sold his shares for £7,000. When questioned about the market euphoria, he apparently replied, ‘I am capable of calculating the motions of celestial bodies, but not the folly of people’. By September 1720, the bubble had burst and the share price had fallen below £200, down 80% from the high reached three months earlier. However, despite having recognised the bubble from the start, Sir Newton, like many other investors, could not bear the pressure of seeing everyone around him get rich. He bought back the stock at its highs and ended up losing £20,000.
Not even one of the smartest men in the world remained immune to this tangible lesson in gravity. Because as Warren Buffett says, it is not the high IQ (which is needed, but an average IQ is enough) that helps one to invest, but it is temperament, i.e. the right orientation and reasoning for the long term without getting caught up in emotionalism.
Conclusion
The bull market is born in negativity, develops in scepticism, grows in optimism and dies in euphoria.
One must remember that when one reads in the newspapers and hears experts say that ‘there can be no such thing as too high a price’ for a company, one is in a moment of euphoria. This in fact triggers in the investor the thought that regardless of the price paid, one is sure to make a profit.
At this time in the ‘psychology’ cycle, one must not get caught up in greed, but continue to invest in quality bonds and defensive stocks at a steep discount, two asset classes with returns that were unimaginable just a few years ago. And remember that there is no safe way to participate in a bubble: there is always only danger. Note, however, that ‘overpriced’ does not automatically mean ‘tomorrow the price will fall’.
Many fads last well beyond the moment when they become bubbles. Bubbles are also a natural outcome of markets, since markets are made up of people and people are often driven by sentiment.
For as a great physicist said, physics would be much more complex if electrons had feelings.
The contents of this informative message are the result of the free interpretation, evaluation and appreciation of Pharus Asset Management SA and constitute simple food for thought.
Any information and data indicated have a purely informative purpose and do not in any way represent an investment advisory service: the resulting operational decisions are to be considered taken by the user in full autonomy and at his own exclusive risk.
Pharus Asset Management SA dedicates the utmost attention and precision to the information contained in this message; nevertheless, no liability shall be accepted for errors, omissions, inaccuracies or manipulations by third parties on what is materially processed capable of affecting the correctness of the information provided and the reliability of the same, as well as for any result obtained using the said information.
It is not permitted to copy, alter, distribute, publish or use these contents on other sites for commercial use without the specific authorization of Pharus Asset Management SA.


