Yields and valuations: the delicate balance of 2024
18 December 2024 _ News

The main theme of 2024 has picked up in US markets in recent days, with mega cap tech rising and the rest of the market falling.
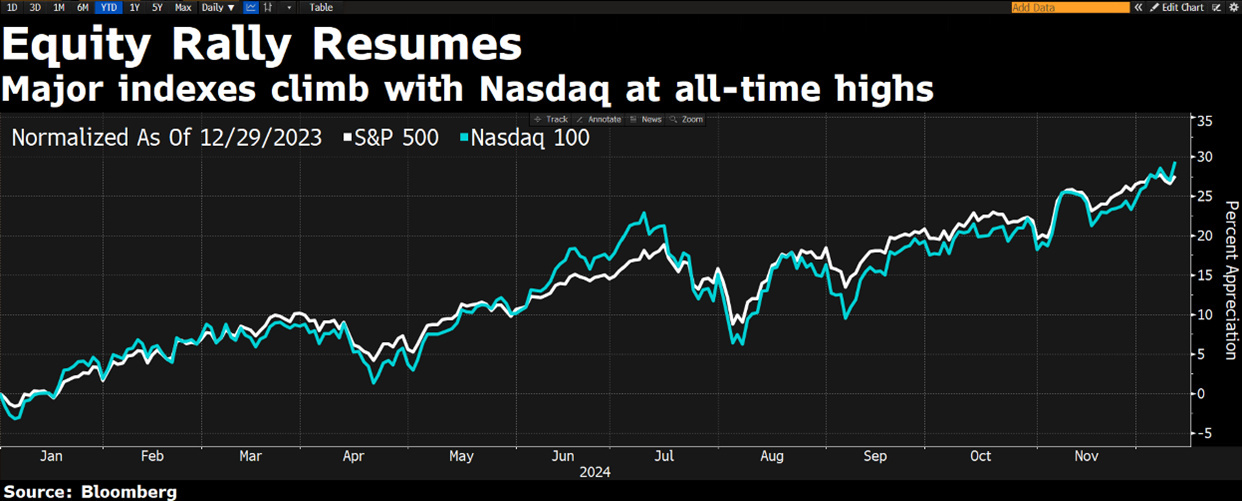
The bond world also fell, with 10-year rates up 20 cents in America and 15 cents in Europe, marking one of the worst weeks of the year for bonds.

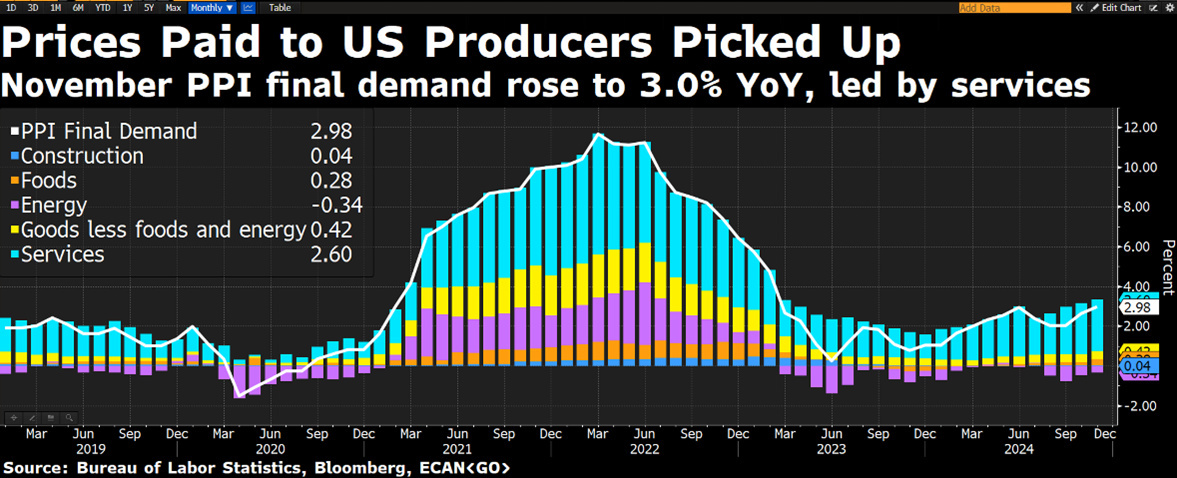
Among the macro data released in the US, we had inflation, with CPI rising 0.3% month-on-month and 2.7% year-on-year in November, in line with expectations, with the path of inflation reduction having stalled somewhat in recent months, but with the figure low enough for the Fed to continue to move towards the neutral rate. Surprising on the upside was the PPI, or inflation measured on the production cost side, which rose 0.4% m/m and 3.5% y/y, with both increases the highest since February 2023 and 80% of these increases justified by food prices.
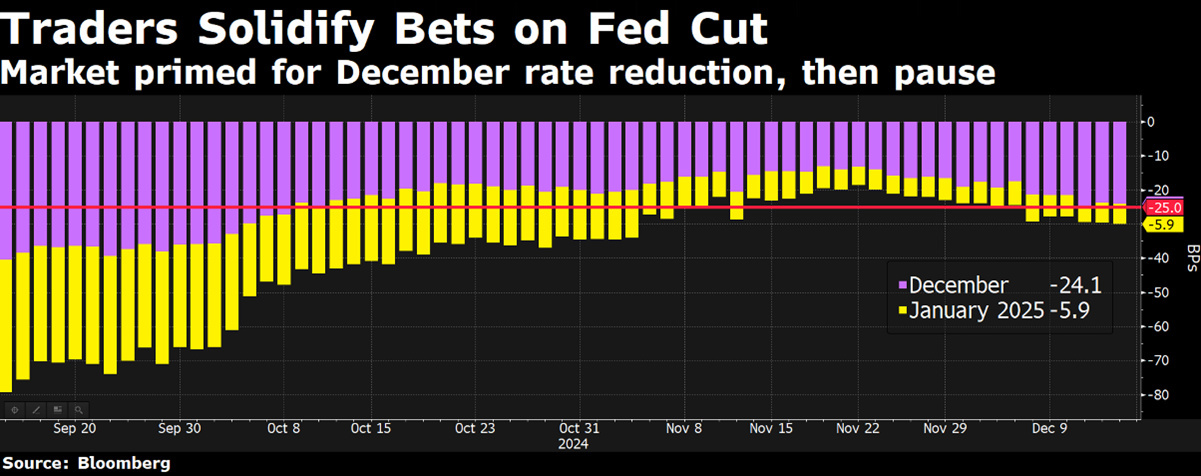
On the labour side, jobless claims came in slightly higher than expected, but overall suggesting a labour market that is not particularly worrying. The market is pricing in a 98% probability that the Fed will cut rates by 25bps on 18th December, with only two further cuts planned for the whole of 2025, with the focus on the press conference as the Fed could cut, but in a hawkish tone.
Other central banks cut rates during the week, including the ECB, which acted in line with market expectations with its third consecutive 25 basis point cut, raising rates to 3.00% and revising down its growth and inflation forecasts for the coming years, with the market now expecting rates in Europe to reach 2% by the end of 2025. The Swiss National Bank also cut rates by 50 basis points to address the opposite problem in many countries, namely low inflation and a strong currency.
This will be the last podcast of 2024 and we'll be back on 12 January after the Christmas holidays, so let's take a look at the dynamics between the only two things that matter when it comes to stock markets: earnings growth and valuations.
It is the combination of rising earnings and rising valuations that is driving this bull market. Normally these two factors move in opposite directions (as price tends to anticipate earnings), and it is not often that we see them moving in the same direction together as we have this year. However, this is not the first time in history that this has happened, as there have been other occasions, such as 2012-2014 or 2016-2017, when both factors rose, leading to exceptional gains and above historical averages.
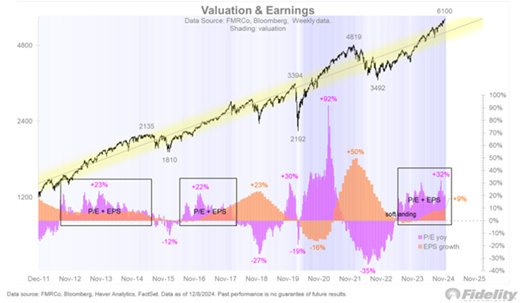
Usually, the expansion of multiples occurs in the first year of a new bull cycle, which, let's remember, started in October 2022, so it is unusual that valuations are still rising in 2024.
But in the end, what does it mean that valuations are rising? Is it really important to take them into account?
The simple answer is YES, equity valuations can without exaggeration be described as a kind of science, a kind of mathematics, and investing when valuations are high leads to low equity risk premia and consequently low expected long-term returns. It's all there. High valuations equate to low expected long-term returns.
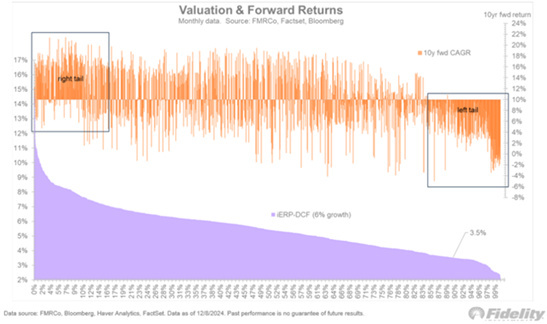
The equity market risk premium (technically known as the equity risk premium) is the difference between the expected return on an investment in equities and the expected return on the 10-year risk-free rate. We prefer to use a DCF model that assumes earnings growth of 6%, in line with the historical average, which gives an ERP of 3.5%, but what the various models have in common is that however you calculate it, it is now well below average and close to all-time lows.
There are different models for calculating the ERP, but the important point is that it is now at the 90th percentile of historical values (since 1900). This means that it has rarely been this low. Valuations are always taken lightly by investors because everyone mistakenly looks at the short term instead of the long term.
In the short term, valuations are notoriously ineffective at predicting expected future returns, but at the extremes of their distribution, i.e. where they are today, they are very important.
If we relate expected returns over the next 10 years to valuations, we can see that the 10-year compound annual growth rate (CAGR) has an obvious right tail and an equally obvious left tail. In the right tail, very low valuations lead to above-average returns over the next 10 years, while in the left tail, very high valuations lead to below-average returns over the next 10 years. Between the two tails, there is no clear and unambiguous relationship between returns and valuations.
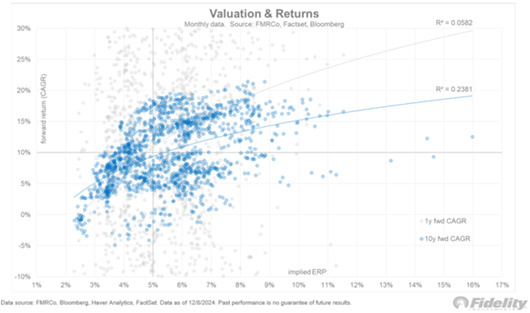
However, if we look at the short term and consider returns over just 1 year instead of 10, we can see that there is no specific relationship between valuations and returns. This shows that high valuations can persist for quite some time before they become stretched, so that investing at these prices will produce zero returns over the next 10 years.
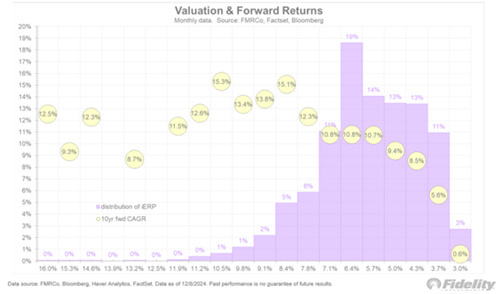
Looking at the distribution of the equity risk premium and returns over the next 10 years, it seems reasonable to conclude that current valuation levels are not yet such as to lead to zero returns, but we are getting dangerously close.
We have said several times that when we look at the details of the market, we see a U-shaped distribution of companies. On the left are companies that are cheap but lacking in quality and growth and therefore have poor long-term prospects. On the right are companies with high growth but overvalued in the short term. In the middle is a decent range of cheap or even discount companies that should be able to grow and show resilience over time. We believe this will be the likely winning area of the market in 2025, but it will require great selectivity. And the European market, for example, where there is a lot of negativity, is full of such stories within the non-discretionary consumer sectors, pharmaceuticals and even luxury.
The contents of this informative message are the result of the free interpretation, evaluation and appreciation of Pharus Asset Management SA and constitute simple food for thought.
Any information and data indicated have a purely informative purpose and do not in any way represent an investment advisory service: the resulting operational decisions are to be considered taken by the user in full autonomy and at his own exclusive risk.
Pharus Asset Management SA dedicates the utmost attention and precision to the information contained in this message; nevertheless, no liability shall be accepted for errors, omissions, inaccuracies or manipulations by third parties on what is materially processed capable of affecting the correctness of the information provided and the reliability of the same, as well as for any result obtained using the said information.
It is not permitted to copy, alter, distribute, publish or use these contents on other sites for commercial use without the specific authorization of Pharus Asset Management SA.


